
Mapping complex business workflows to understand goals, behaviors, pain-points and processes of target user groups.
📌 Project Scope:
Timeline: 5 months (Apr ’24 - Aug ’24)
My Role: UX Researcher (end-to-end)
UXR Methods: Desk Research, Journey Mapping (co-creation workshops)
Tools: Lucidspark, MS Office, MS Teams
Stakeholders: Product owners (Asset Digitization)

⚙️ Business Context
In February 2024, the AD Product Owners created a Vision for a new and better enterprise applicaiton - “To empower our teams with actionable insights and create exceptional value for our internal users through innovation and collaboration”. The Mission was to “To provide a trusted set of capabilities that transform raw data into consumable information for actionable business decisions”.
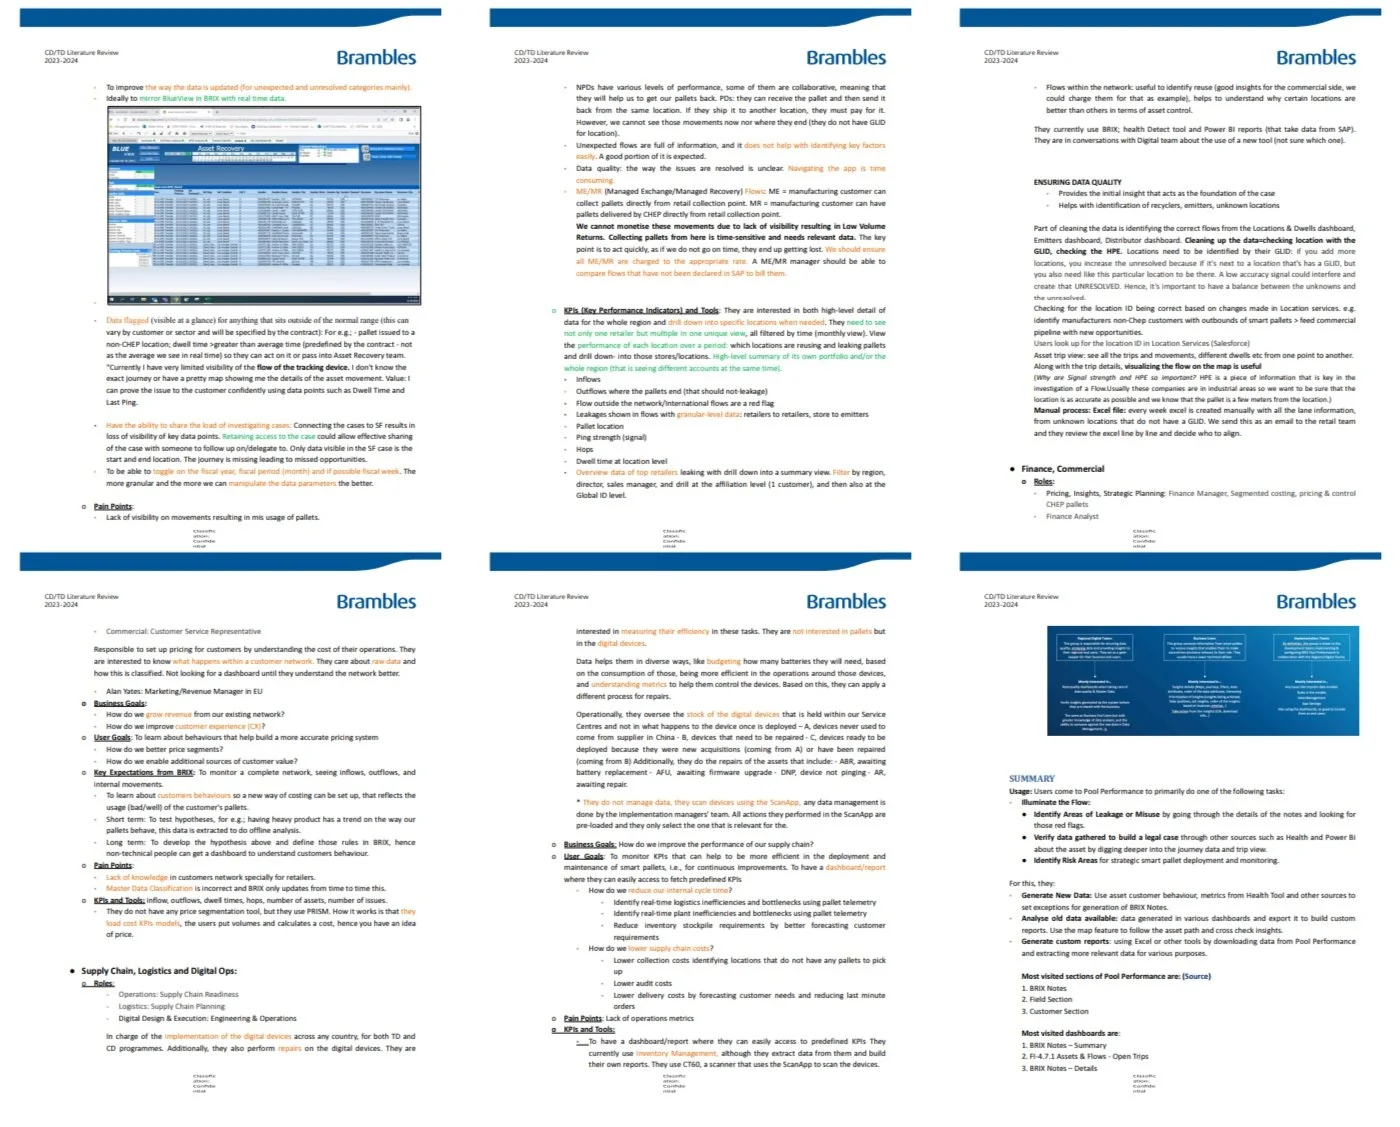
Desk Research:
In order to build a clear UX Research plan for this mission, I recognized the need for conducting a literature review of relevant works. Reviewing 10+ sources to consolidate key learnings, information and insights from past user research into a single source of reference — revealing fundamental insights to ground future decision-making in established theory and known context while maximizing the team’s impact-to-effort ratio.


Classification: ConfidentialWhat prompted the research intervention?
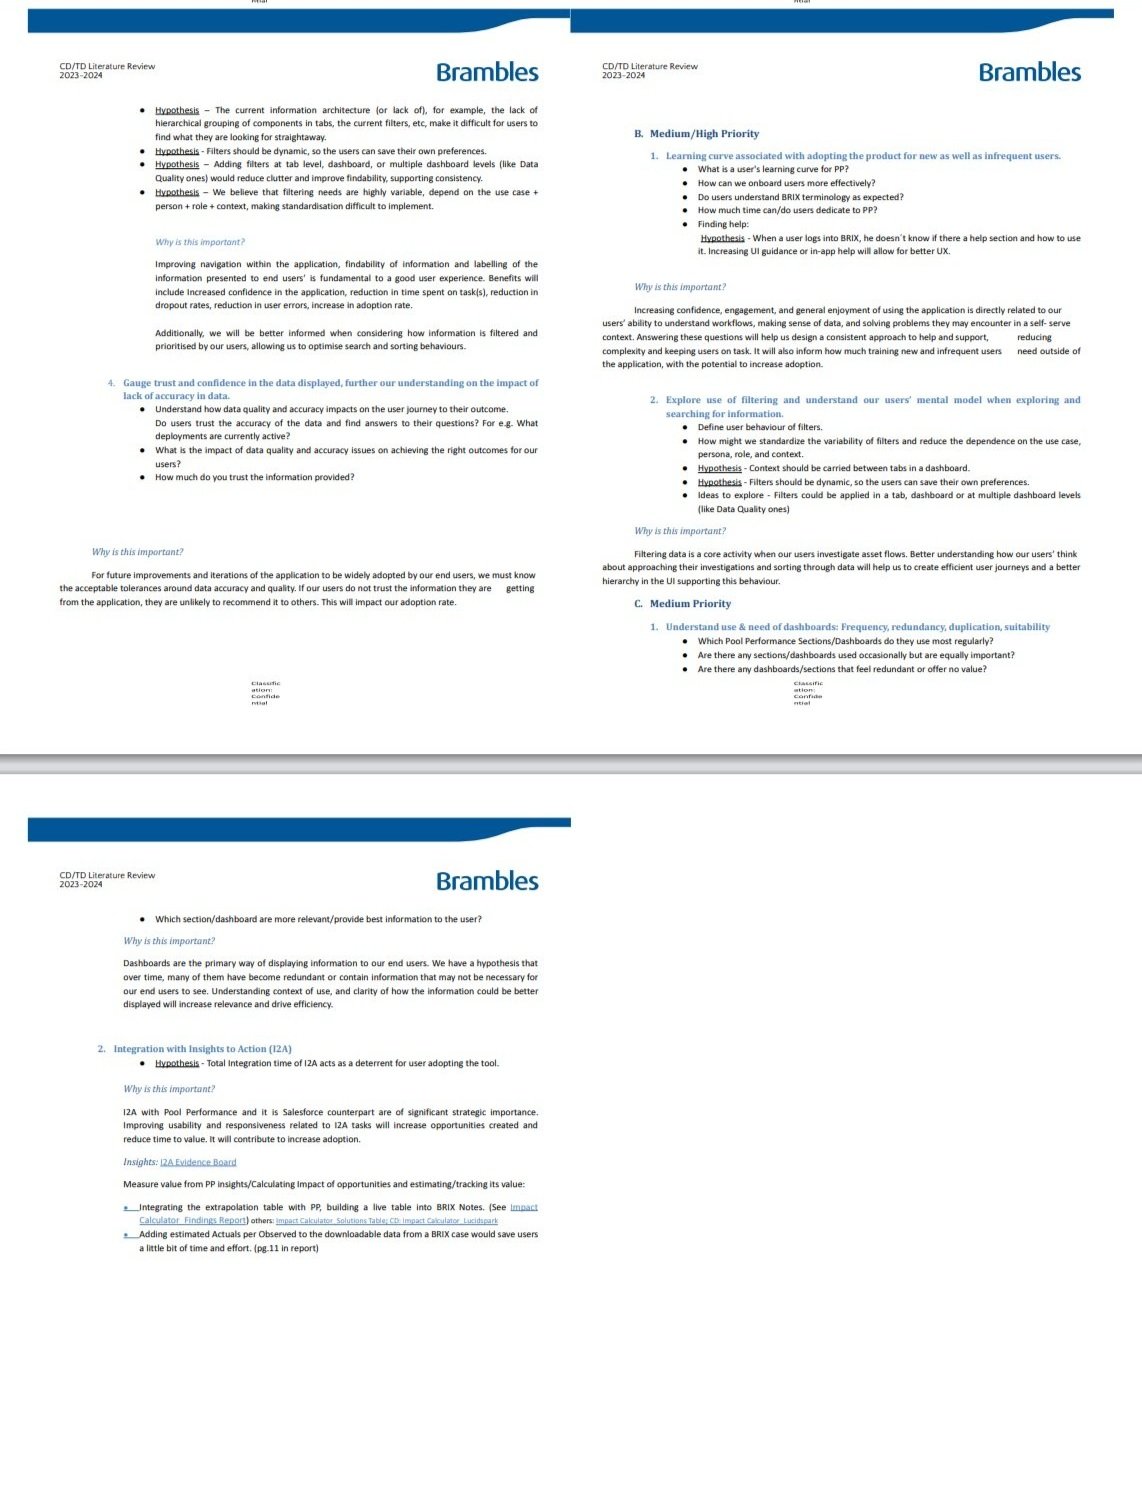
Based on missing contexts and assumptions, I created a list of strategic and tactical research questions and hypotheses that needed to be addressed through combined team efforts. While some of the questions were answered by the Product Owners and SMEs, research intervention was required for the rest: to investigate the approach and processes followed by target user groups; specifically to:
Explore attitudes, behaviors and mental models around collaboration, traceability and sharing of asset (CHEP pallets) insights.
Understand how the PP app (enterprise app in scope) fits into the broader app ecosystem and user’s workflow.
Gauge the trust and confidence in the data displayed and the processes involved to make asset data usable.
Research Objectives
⚙️ Understand similarities and differences in workflows
and user behaviors when investigating supply-chain issues in various business regions and across teams.
🔎 Identify day-to-day challenges and pain-points
related to information needs; channel use (tools/platforms used to complete investigations); workflows and processes.
📎 Analyze and map a consolidated user journey
for answering strategic and tactical questions in scope for the design and development of the app.
Specific Research Questions:
Journey stages, touch-points and interactions:
User Goals and Motivations:
Pain Points:
Opportunities for Improvement:
What are the key stages in the user journey of target user groups?
What actions need to be performed during each step of workflow process?
What are the key touch points and interactions where users engage with the current app in their journey?
What are the key touch points and interactions where users engage with other channels (tools, apps and reports) in their journey?
What are the primary user goals attached to smart-asset data?
What are the essential business questions that users are looking to get answers to?
What KPIs or metrics that are essential or meaningful to answering the business questions?
What does a change in a KPI or metric tell the user in the context of the action?
Where do users experience difficulties or frustration during their journey?
What needs or expectations are unmet at different stages of the journey?
Where are the gaps in the current app according to the user that hinder their workflows?
How might the ‘new app’ address current workflow gaps and user pain-points?
How might the ‘new app’ improve the user experience or add value in the user workflow?
🗺️ Journey Mapping
Approach & Methodology:
A user journey map provides a holistic view of the current user experience, with a detailed breakdown of the actions taken by the user to achieve a particular goal or task. In the project context, this method has been chosen here for its ability to provide a comprehensive, visual representation of the entire user journey, integrating various user experiences into a single artifact. This method is beneficial here because its collaborative and reliable to reveal where the needs, pain points, motivations and opportunities lie in the journeys of the users with varying titles, roles and geographical locations. Here, it will enable stakeholders and product teams to develop targeted strategies for enhancement or optimization of user experience for the ‘new PP app’.
Rationale for using User Journey Mapping over other research methods: Here’s why I preferred User Journey Mapping over a few other considered research methodologies:
Surveys: Limited in depth and may miss nuanced user experiences and emotional states.
Usability Testing: Focuses on specific tasks or features, not the entire journey.
Analytics Review: Provides quantitative data without qualitative insights into user emotions and motivations.
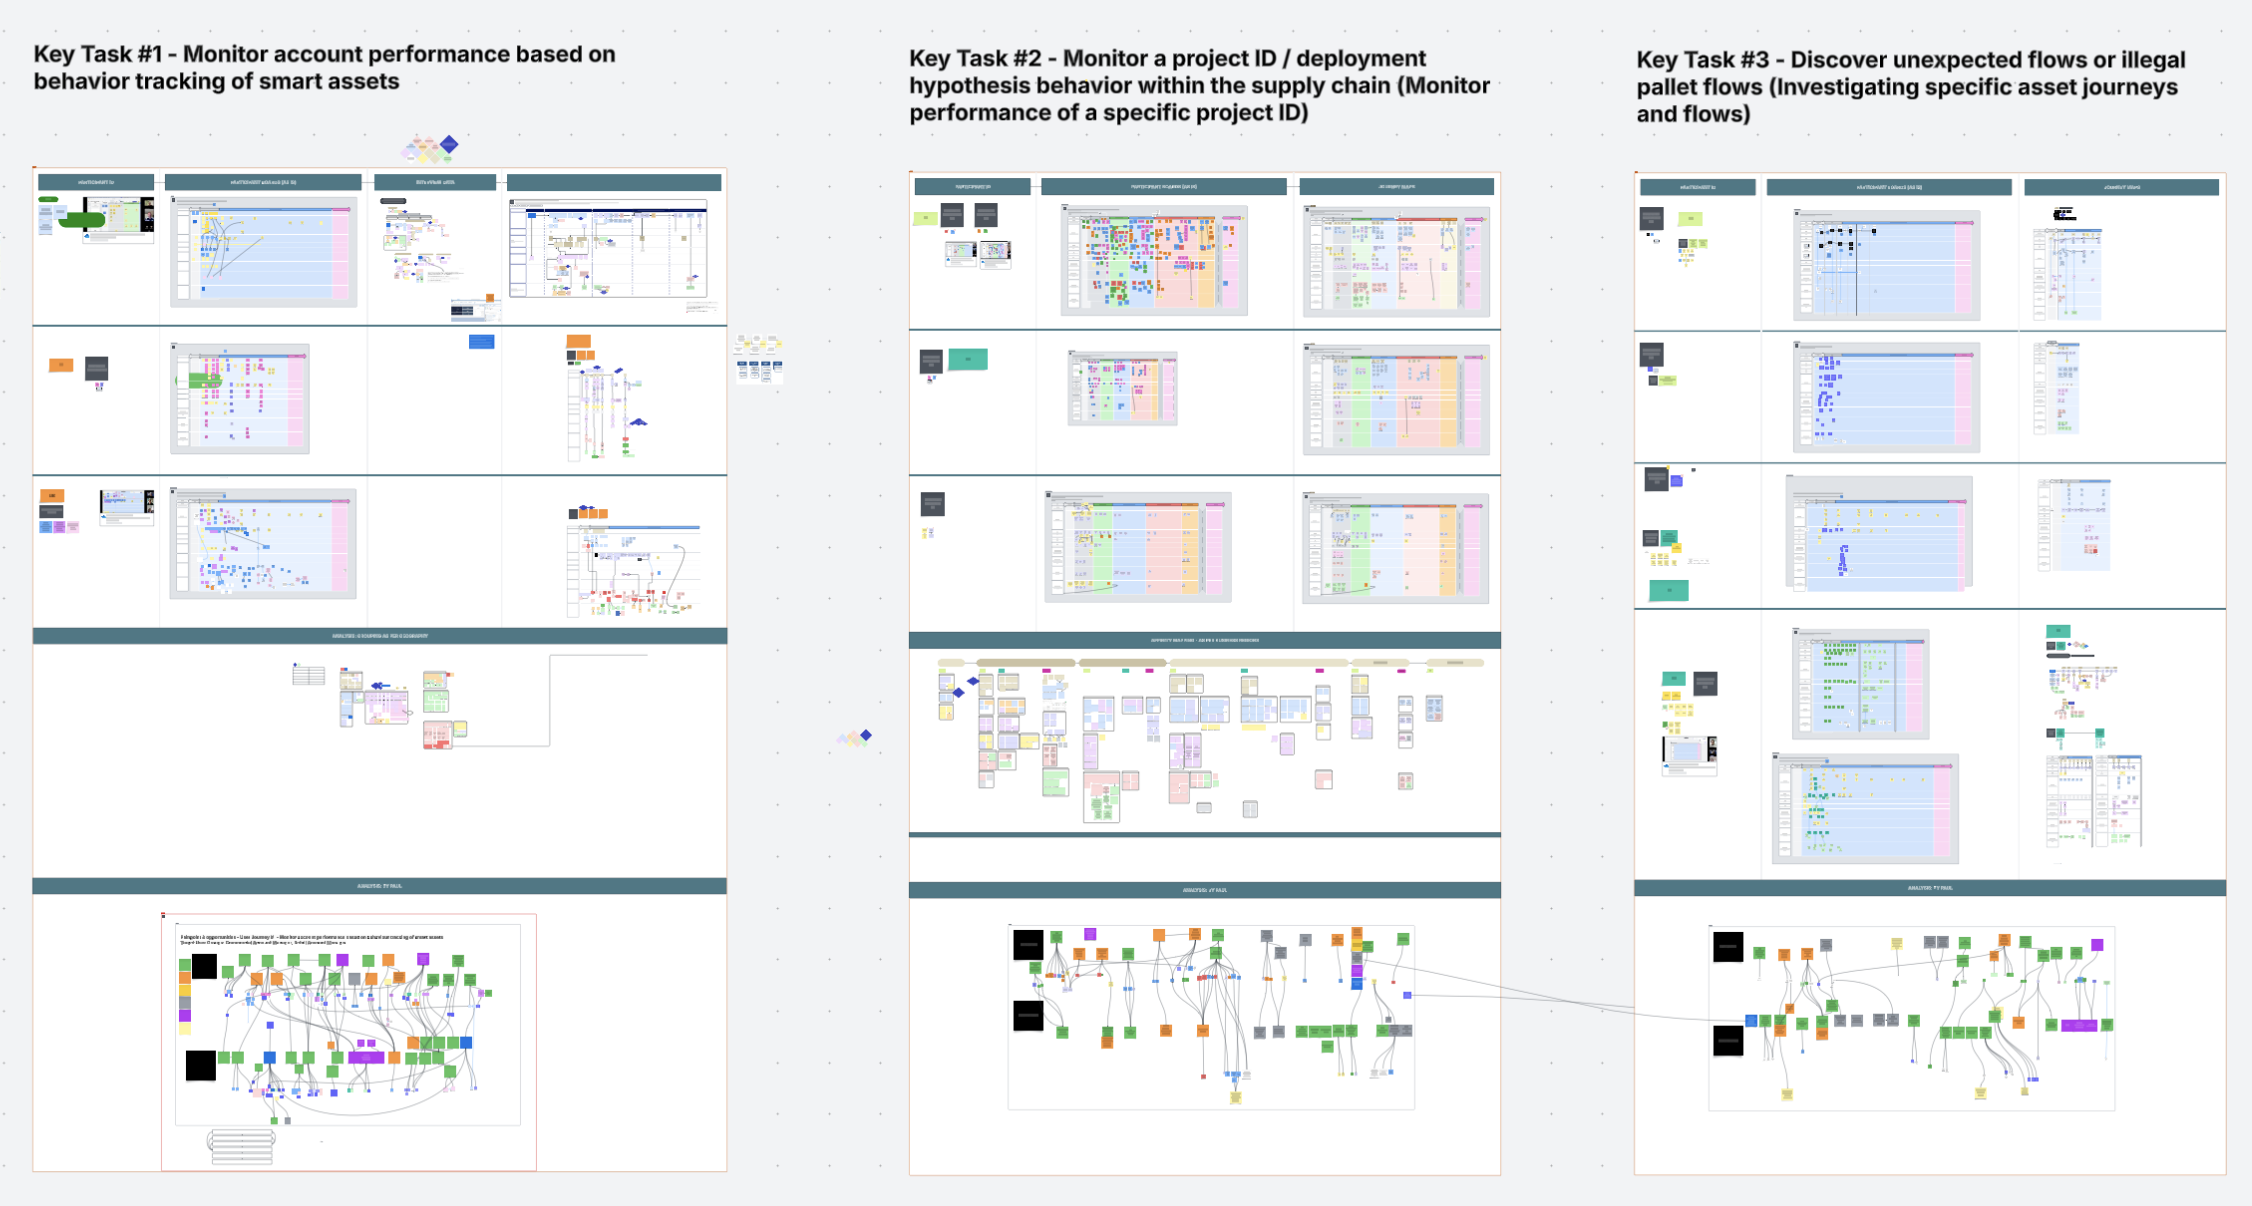
Journeys:
Based on key business and user goals, the exercise was narrowed down to 3 tasks:
1. Monitor customer account performance based on behavior tracking of smart assets.
2. Monitor a project ID or a deployment hypothesis within the supply chain.
3. Discover unexpected flows or illegal pallet flows.
🚀 One final check:
✅ Participants recruited ✅ Consent forms sent ✅ Evidence board set-up ✅ Discussion guide created
Focus Groups & Co-creation
The Process:
Users were asked to share their approach and process for the given tasks, expressing their goals, questions, actions and pain-points using post-it notes on the boards.
Affinity Mapping
The data gathered through the wokrshops was furthered grouped to identify emerging themes and patterns in the form of an affinity map, organized by business regions.

Summary of Findings
1. Consistent needs, no consistent workflows
2. A whole lot of manual..
3. Context matters.
4. Alert! — a change in KPI value
5. Customers want to know too!
There are over 50 dashboards across the current app as well as other business tools and channels that users rely on for everyday KPIs and metrics. Repetitive and inconsistent data makes workflows complicated and users must look across several dashboards to find the data that is both relevant and reliable.
The current app provides data, not insights. With high manual efforts and workaround solutions built around the data analysis process to identify customer performance trends and insights, users across geographies and teams have resorted to custom solutions outside the current app (e.g. spreadsheets, dashboards and reports) — leading to extensive time taken, operational inefficiencies and high possibilities of finding conflicting insights that need to be vetted thoroughly before interacting with customers.
Business KPIs can tell a lot about customer performance. However, terminologies and definitions of KPIs can be context subjective and a change in value could indicate a ripple effect of changes to other KPIs — making it challenging to interpret what that could mean for the business or the customer. Users’ referencing of metrics to measure customer performance was found to be inconsistent across teams and geographies.
Customers are interested in insights from the business as well to learn more about their supply chain behaviors and what they can do to optimize operational efficiency. Sharing business KPIs and insights is far from a just a click for business user as the current app is focused only on internal users and does not offer ready-to-share views that can spark insightful conversations and targeted solution implementation.
When conducting customer account investigations, Account Managers must have context on the customer and its behavior patterns - e.g. account size, operation style, business activities, past performance, proximity to pallet dealers, level of cooperation, etc. for dealing with them strategically. This level of nuance is highly reliable on the user’s experience in the company and understanding of the business and customer relations.
🤔 How might we?
Foster the power of Brambles Smart-asset data to optimize the workflows of business users and unlock customer value?
Empower Account Managers with the right narratives and relevant KPIs that help them identify emerging trends and themes related to their accounts portfolio?
Keep Account Managers informed about changes in the account performance and enable them to take informed actions quickly?
Create opportunities for Account Managers to engage in strategic and insight-oriented conversations with customers?
🌟 Business Impact
Based on these insights, the product stakeholders were able to gain a holistic understanding of the user journeys and translate the vision and mission statements into a solution offering that has a defined scope, highlighting potential opportunities, risks and limitations to address real user needs, goals and challenges.

“I’ve had the pleasure of working with Niti over the past 2 years at Brambles, where her work was always thoughtful and impactful. Niti led both holistic research into our end-to-end customer journeys and more targeted research on specific feature enhancements. She has been a fantastic partner in product development. Her work not only surfaced key user insights but also helped embed a truly user-centric mindset across our product teams.”
Rafael A Hernandez Irigoyen | Senior Product Manager - Asset Tracking @Brambles
💭 Personal Takeaways
This project/study served as a critical milestone in defining the future of the Asset Digitization enterprise solutions. It was extremely humbling for me to navigate a sea of past and present research insights and tie them together to represent user-centricity in a concise and definitive manner, while utilizing all efforts to create true business impact.